
Why analyse diversity and inclusion?
The analysis of diversity and inclusion is essential due to their significant impact on a company’s success and competitiveness. According to recent studies (McKinsey), companies with diverse teams outperform their sector’s average financially. Moreover, team diversity fosters innovation, creativity, and employee retention.
When should diversity and inclusion be measured?
- At least once a year to measure changes in practices and behaviour (recommended)
- When integrating new employees
- During periods of major changes in the company (new strategy, new management, new team, etc.).
What are the benefits?
For the employer
- Reinforcing the company’s culture and social responsibility
- Contributing to a better understanding of employees’ needs and expectations
- Identifying areas for improvement in diversity and inclusion management
For employees
- Enhancing the sense of belonging and inclusion among employees
- Improving the perception of fairness and justice within the company.
- Increasing motivation and commitment at work
Ensure the success of your inclusivity policy with Balencio

Choisissez l’un de nos modules clé en main, personnalisez-le au besoin

Déterminez les groupes-cibles de collaborateurs à sonder

Balencio les questionne et les relance pour vous si nécessaire

Les travailleurs reçoivent leurs résultats ainsi que des options d’accompagnement
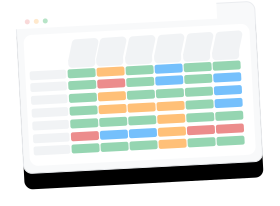
Vous obtenez un aperçu global et anonymisé des résultats

Vous identifiez vos points d’action en un clin d’œil

Suivez l’évolution des résultats dans le temps et comparez-les au benchmark