Analyze
Compare Teams and Groups with Balencio Analytics
Easily compare results between the groups of your choice.
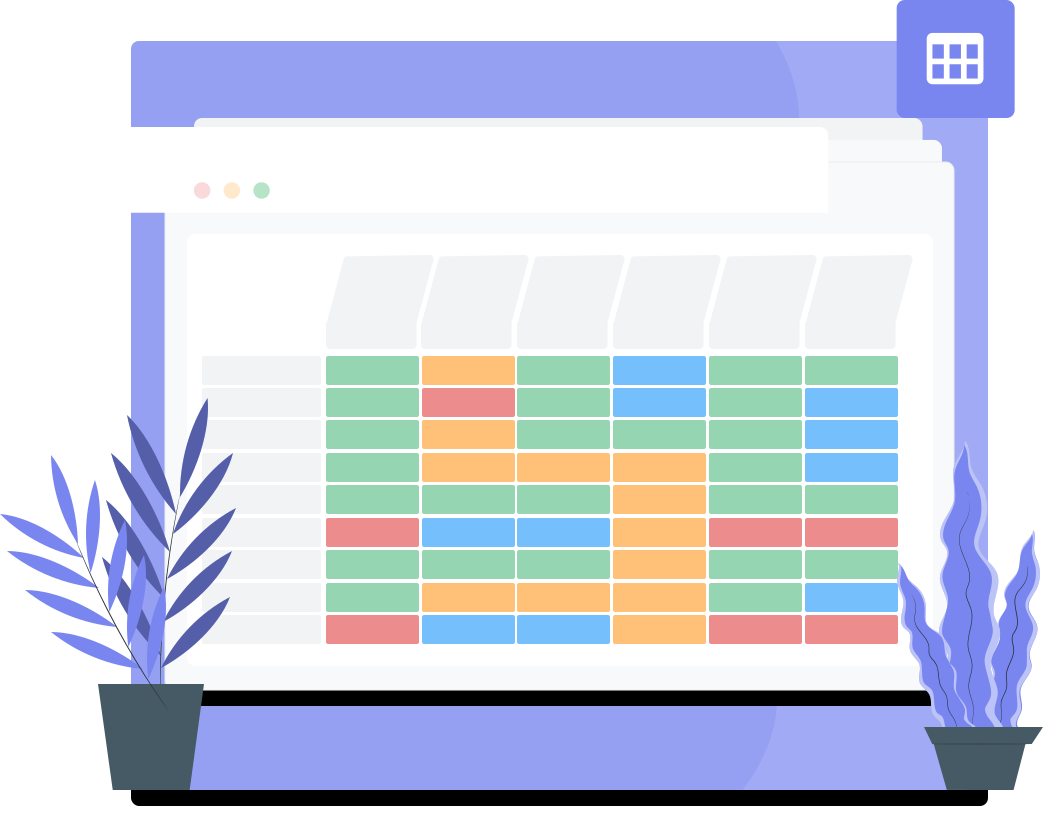
Highlight significant differences
Segment the results of your survey according to relevant criteria such as geography, socio-demographics or job profile. This segmentation will enable you to analyse the data by group and highlight any significant differences.
Identify specific actions to be taken
By comparing groups, you’ll be able to identify which groups need special attention You can then implement specific actions to improve their satisfaction, engagement and performance.